Test machine specs:
Intel X5 3.2 Ghz, 6 core
24 GB Ram
5 x 120gb OCZ Vertex 3 SSD, Read: 550MB, Write 500MB
2 x 60gb OCZ Vertex 3 SSD, Read: 535MB, Write 480MB
4 x 1TB Western Digital WD1003FBYX-01Y7B1 HDD, Read:140MB, Write:140MB
LSI 9220-8i 8xGBs SAS contoller - 8x PCIE 2.0 = 4GBs max bandwidth
The mix of SSDs and HDDs was chosen based on the bandwidth limitation of the SAS controller. I wasn't sure how storage spaces would perform with a mix of SSDs and HDDs so I split the test in to two groups, one with just SSDs and another with all the disks. I also ran each test with drives formated in NTFS and ReFS so I could compare the differences in file system performance.
Speed:
6xSSDs = 3820MBs
4xHDDs = 560MBs
Total = 4020MBs
Size:
7SSDs = 783GB
7 SSDs & 4 HDDs = 3.49 TB
Layout - simple
Max Read: 2574MBs
Max Write: 2593MBs
Disks - 7SSDs
Provisioning type - thin
Volume format - NTFS
Layout - 2 way mirror
Max Read: 2776MBs
Max Write: 1344MBs
Disks - 7SSDs
Provisioning type - thin
Volume format - NTFS
Layout - 3 way mirror
Max Read: 2747MBs
Max Write: 941MBs
Disks - 7SSDs
Provisioning type - thin
Volume format - NTFS
Layout - simple
Max Read: 2130MBs
Max Write: 2105MBs
Disks - 7SSDs & 4HDDs
Provisioning type - thin
Volume format - NTFS
Layout - Parity
Max Read: 954MBs
Max Write: 151MBs
Disks - 7SSDs & 4HDDs
Provisioning type - thin
Volume format - NTFS
layout - 2 way mirror
Max Read: 810MBs
Max Write: 471MBs
Disks - 7SSDs & 4HDDs
Provisioning type - thin
Volume format - NTFS
Layout - 3 way mirror
Max Read: 874MBs
Max Write: 306MBs
Disks - 7SSDs & 4HDDs
Provisioning type - thin
Volume format - NTFS
Layout - Simple
Max Read: 948MBs
Max Write: 862MBs
Disks - 7SSDs & 4HDDs
Provisioning type - thin
Volume format - ReFS
Layout - Parity
Max Read: 908MBs
Max Write: 135MBs
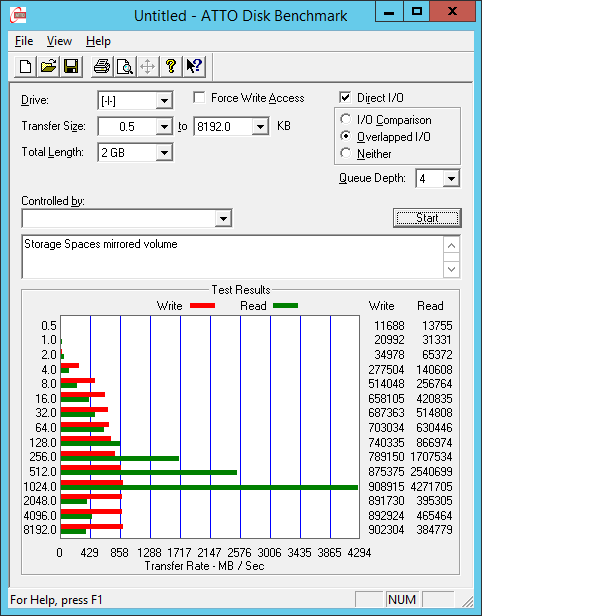
Disks - 7SSDs & 4HDDs
Provisioning type - thin
Volume format - ReFS
Layout - 2 way mirror
Max Read: Inconsistant 33-3570MBs
Max Write: 141MBs
Disks - 7SSDs & 4HDDs
Provisioning type - thin
Volume format - ReFS
Layout - 3 way mirror
Max Read: 1077MBs
Max Write: 346MBs
Disks - 7SSDs & 4HDDs
Provisioning type - thin
Volume format - ReFS
- Edited by Dustyny1 Tuesday, August 28, 2012 10:59 PM